A SCIENTIFIC APPROACH TO INVESTING
MUST YOU INVEST?
Having a nest egg gives you options (and yes, the larger your bank account, the more options). Want to switch careers, work part-time, or live in Costa Rica? Or just be sure you can maintain your current lifestyle for the rest of your life? Saving and investing today, gives you options for tomorrow.
One of our goals for this year is to help our clients as much as we can. We want to do this by making you aware of everything we can help with! We do a lot more than just investing. Here are some additional services we provide at Harvard Ave that might benefit you:
Insurance
Life Insurance Planning (for those with children at home)
Work Benefits Planning (for those choosing between company-offered plans)
Medicare Planning (for retirees navigating the complications of Medicare)
Estate Planning
Creating a Will (used to designate who will have custody of your children)
Planning a Trust (used to designate inheritance of assets)
Financial Planning
Retirement Simulations (how much money will you have in retirement?)
Creating a Plan (did you like that number above? Let's adjust your savings rate, portfolio, etc. to help you create a great retirement)
401k Investing (let’s take a look at your 401k plan offerings and how best to invest those)
Tax Planning
Tax Plan Meeting (send us your return forms and we'll plan for next year's savings)
Tax Loss Harvesting (selling depreciated assets to lower taxable income)
Roth Conversions (transferring pre-tax money to Roth allows for tax-free withdrawals in the future)
Charitable Donations
Charitable Funds (invest money marked as donations for a large single-year itemized deduction with earnings over time)
Donations from IRA (for those over 70½, donate IRA funds to avoid income tax on withdrawals)
Donations from Taxable Account (donate appreciated assets to avoid capital gains taxes)
Saving for Children
529 Plans (saving for children’s education expenses in a highly tax-efficient account)
Financial Education
We are teachers at heart! We want you to understand all that we are doing for you and your financial future if it interests you.
If you are looking to do anything financial (buy a house, get a loan, etc.) we want to talk to you and help you make the best decision.
We would love to work with children of clients who are starting on their investing journey to learn about the stock market and good saving habits
There are also a few things we do behind the scenes!
Investment
We invest your money using effective tried-and-true strategies, tilting towards markets that historically outperform. Global diversification through ETFs provides stability and growth. Risk-based investing allows your money to grow according to your needs.
Withdrawal Strategy
For those in retirement, we take into account the sequence of returns risk and distribute your money to give you the best tax situation possible.
Let us know if any of these sound like something you’d be interested in doing with us! And of course, any questions you have, we want to answer.
Is Social Security Enough?
Social Security should provide some income, and perhaps you have a pension that will also help out. However, because Social Security is only enough revenue to subsist in life, your portfolio is where you will get the extra funds that add abundance.
Investing Version 1.0 and 2.0
For years, investing was thought of as picking winning stocks, and doing it at the right time. This idea of how to invest has dominated our philosophy of what we “should” do.
Investing 2.5: the four factors
Starting in the 1970s, ways to increase the returns in your portfolio started to come out in academic research.
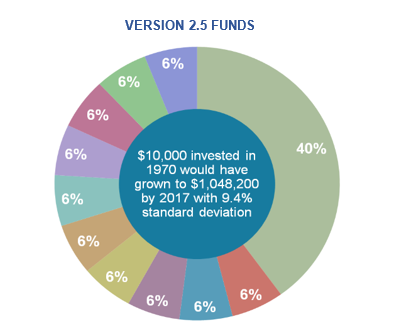
So you would be wise to use these Investing 2.5 principles when building up your portfolio. Look at the same ratio of stocks to bonds (60% stocks and 40% bonds) that we looked at in Version 2.0 Investing.
Implementing 2.5 Tilt Toward Better Performing Assets
So you would be wise to use these Investing 2.5 principles when building up your portfolio. Look at the same ratio of stocks to bonds (60% stocks and 40% bonds) that we looked at in Version 2.0 Investing.
DISCLOSURES


